SPIOT: Difference between revisions
No edit summary |
|||
| (2 intermediate revisions by the same user not shown) | |||
| Line 9: | Line 9: | ||
[[File:Spiot_picture.png | 600px]] | [[File:Spiot_picture.png | 600px]] | ||
==Summary== | |||
Spiot is a very simple framework using usual components such python/sqlite3/html/dygraph/javascript. | |||
This minimalist framework allows you to record data in a sqlite3 database. The database format is very portable as it records in flat files. Follow the given examples to build your own html page with the powerful graph based on dygraph. | |||
Spiot does not intend to make a ready web configurable platform. However the simplicity is offered to customise your own page with html. | |||
==Download== | ==Download== | ||
[http://lechacal.com/SPIOT/spiot_v1. | [http://lechacal.com/SPIOT/spiot_v1.1.zip SPIOT_V1.1] | ||
==Installation== | ==Installation== | ||
| Line 28: | Line 36: | ||
The best is to have a LAMP based server with python installed. Copy the spiot folder to the server root. | The best is to have a LAMP based server with python installed. Copy the spiot folder to the server root. | ||
Make sure you have a cgi-bin directory defined to spiot/cgi-bin. | Make sure you have a cgi-bin directory defined to spiot/cgi-bin. | ||
==Using SPIOT== | |||
[[File:Spiotrealtime_001.png | right | 300px]] | |||
Download and install [[SPIOT | SPIOT]] on a given server. This could be the raspberrypi itself. | |||
From the downloaded archive there is a directory called rpi containing python scripts and configuration file. Copy all these files on the raspberrypi (if not already there). | |||
Make sure all .py files are executable: | |||
$ chmod 755 *.py | |||
Open the spiot.config file and modify the csv_forward section. port and hostname variable will be the most important ones for a first test. Keep apikey and node as they are to follow this example. | |||
[csv_forward] | |||
port = /dev/ttyAMA0 | |||
hostname = myserver/spiot | |||
apikey = qbG31dQxFlG55mNM8G5ZTFkF0mrUbWg5 | |||
node = 20 | |||
baud = 38400 | |||
Then run the spiot_csv.py utility. | |||
$./spiot_csv.py | |||
Then point your webbrowser to the link below: | |||
http://myserver/spiot/realtime.html?apikey=qbG31dQxFlG55mNM8G5ZTFkF0mrUbWg5&node=11&fields=f001 | |||
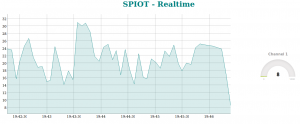
The last 5 minutes of the first channel will be shown on a graph. | |||
Latest revision as of 09:09, 16 September 2021
SPIOT - Simple Python Internet Of Thing.
- Python API over CGI
- Sqlite database
- Dygraph generated graph
- JustGage gauge display
Summary
Spiot is a very simple framework using usual components such python/sqlite3/html/dygraph/javascript.
This minimalist framework allows you to record data in a sqlite3 database. The database format is very portable as it records in flat files. Follow the given examples to build your own html page with the powerful graph based on dygraph.
Spiot does not intend to make a ready web configurable platform. However the simplicity is offered to customise your own page with html.
Download
Installation
Quick Install
Download the package above and extract in a folder. Go to the spiot folder and run the python server.
$ ./run_server.sh
Go to the link below:
http://127.0.0.1:8000
Production installation
The best is to have a LAMP based server with python installed. Copy the spiot folder to the server root. Make sure you have a cgi-bin directory defined to spiot/cgi-bin.
Using SPIOT

Download and install SPIOT on a given server. This could be the raspberrypi itself.
From the downloaded archive there is a directory called rpi containing python scripts and configuration file. Copy all these files on the raspberrypi (if not already there).
Make sure all .py files are executable:
$ chmod 755 *.py
Open the spiot.config file and modify the csv_forward section. port and hostname variable will be the most important ones for a first test. Keep apikey and node as they are to follow this example.
[csv_forward]
port = /dev/ttyAMA0
hostname = myserver/spiot
apikey = qbG31dQxFlG55mNM8G5ZTFkF0mrUbWg5
node = 20
baud = 38400
Then run the spiot_csv.py utility.
$./spiot_csv.py
Then point your webbrowser to the link below:
http://myserver/spiot/realtime.html?apikey=qbG31dQxFlG55mNM8G5ZTFkF0mrUbWg5&node=11&fields=f001
The last 5 minutes of the first channel will be shown on a graph.
